
Shot Quality in High Definition: The Play-by-Play Upgrade

Recap: The Old Tracking-Based Model (Bins and Baselines)

In the first iteration of this project, we built a shot-quality model using NBA player tracking data. Every shot a player took was placed into a contextual bin based on three factors:
Shot type: We categorized attempts as catch-and-shoot jumpers, pull-up jumpers, or interior shots (“< 10 ft”).
Nearest defender distance: Ranged from very tight (0–2 ft) to wide open (6+ ft).
Touch time: How long the shooter held the ball (<2 seconds, 2–6 seconds, or 6+ seconds).
This yielded 28 possible bins each season (some combinations like catch-and-shoot with a very long touch time don’t occur). Each bin acted like a difficulty category. For every bin, we calculated the league-average field-goal percentage for twos and for threes in that context, giving an expected value for any shot landing in that bin. Summing those up for a player’s season gave their expected points (xPTS) – essentially, what an average NBA shooter would’ve scored if they took the same shots.
We could then compare a player’s actual points from those attempts to the expected points. The difference was called Points Added (PA) – how many points above or below expectation the player scored. We also derived a volume-neutral Shot_Making metric: the per-shot advantage, i.e. (PTS- xPTS) per FGA. Positive values meant the player hit tougher shots or shot better than average, while negative values meant they underperformed the difficulty of their shots. Crucially, all players were judged against the same league baseline for the same shot contexts each season. So it wasn’t just “did you take easy shots?” but rather “what did you do above or below what those shots are typically worth?” This allowed us to separate shot-making skill from shot selection.
What worked: This tracking-based model accounted for defender proximity and self creation, giving credit to players who hit contested fadeaways and acknowledging those who thrive on open looks. It was also era-aware on a season-by-season basis – the league averages updated each year, so a 35% three-point shooter in 2005 was judged against the standards of that era, not today’s. We even added a post-process normalization for overall pace and scoring environment across seasons, so you could compare players from slower, low-scoring eras to today’s high-octane offenses on equal footing.
Where it fell short: The bin approach lacked fine location granularity. Notably, all shots inside 10 feet were lumped together, from point-blank layups to tricky floaters. That meant a master of the 8-foot floater like Nikola Jokić didn’t get full credit – the model treated those shots the same as easier layups at the rim. In other words, context was coarse: a toe-on-the-line long two and a 15-foot jumper might end up in the same bucket, even if one is clearly tougher. It also ignored time and play context – a hurried heave with 1 second on the shot clock was treated like any other shot of that distance. These limitations set the stage for a more nuanced approach.
Upgrading to a Play-by-Play Powered Model
The new and improved model ditches rigid bins and instead dives into play-by-play (PBP) data for richer context. Rather than categorizing shots by a handful of broad labels, we now use continuous measures and detailed game-state descriptors. Every attempt is tagged with its location and distance on the court, how many seconds into the possession it came, and the time and score situation when it was taken. We also capture whether it was a putback, whether it came off a dead ball, a live-ball turnover, a rebound, or even after a timeout. In short, the model doesn’t just know what shot was taken, but when and how it happened in the flow of play.
Why does this matter? Because it turns vague “<10 ft” categories into precise, contextualized events. A 3-foot layup off a set play and a 9-foot floater after an offensive rebound are both “close shots” in the old bins, but they carry very different expectations. Now, the model recognizes that difference: the floater is harder, the layup is easier, and each is given an appropriate expected value. Similarly, a corner three with 18 seconds on the clock isn’t treated the same as an above-the-break heave with one second left in the quarter. By layering in possession start type and timing variables, the model learns to expect less from rushed, late-clock looks and more from early, clean ones.
To illustrate: imagine two players both shoot 40% from three. One takes wide-open catch-and-shoot looks early in possessions; the other pulls up off the dribble with defenders closing and the clock winding down. Traditional stats treat them the same. The old model at least captured part of the difference (catch-and-shoot vs. pull-up, contested vs. open). But this new model goes further – it “knows” the context of each attempt, down to the timing and how the play began, and assigns expectations accordingly. If both players still hit 40%, the off-the-dribble gunner is credited far more heavily for outperforming those tougher baselines.
All these new factors feed into a shot-level expected value calculation. Think of it like running a logistic regression, where predictors include distance, angle, timing, possession context, and putback flags. The output is a refined expected point value for that exact attempt. Summing those across a season produces a player’s xPTS that truly reflects the difficulty of their shot profile.
In simpler terms, the upgrade is like switching from a blurry broadcast to a high-definition feed. The old model saw all short shots as the same; the new one can actually tell the difference between a clean three-footer and a rushed nine-foot floater, or between a wide-open corner three and a desperate pull-up with the clock expiring. By recognizing when, where, and how a shot happens, the model judges players not just on whether the ball goes in, but on how much harder (or easier) their looks really were. It’s a sharper, more realistic way of capturing the art of shot-making.
Fixing Arena Bias in Shot Data
Before jumping to the results, one calibration we had to make was adjusting for arena or scorekeeper bias in the raw shot data. Each NBA arena has its own scorekeeping crew, and some are more generous than others in labeling shots as “Restricted Area (RA)” versus short jumpers just outside the circle. This matters because RA shots have higher expected value by definition, so mislabeling can skew both player and team metrics. If a scorer consistently undercounts RA attempts, players in that arena will look like they take tougher shots than they really do; if they overcount RA, it makes their shots appear easier.
To spot this, we compared how often shots were classified as RA for both home teams and their opponents forcoffense and defense. If both were consistently shifted in the same direction, it’s a strong sign of a scorekeeper artifact rather than a true playstyle difference.
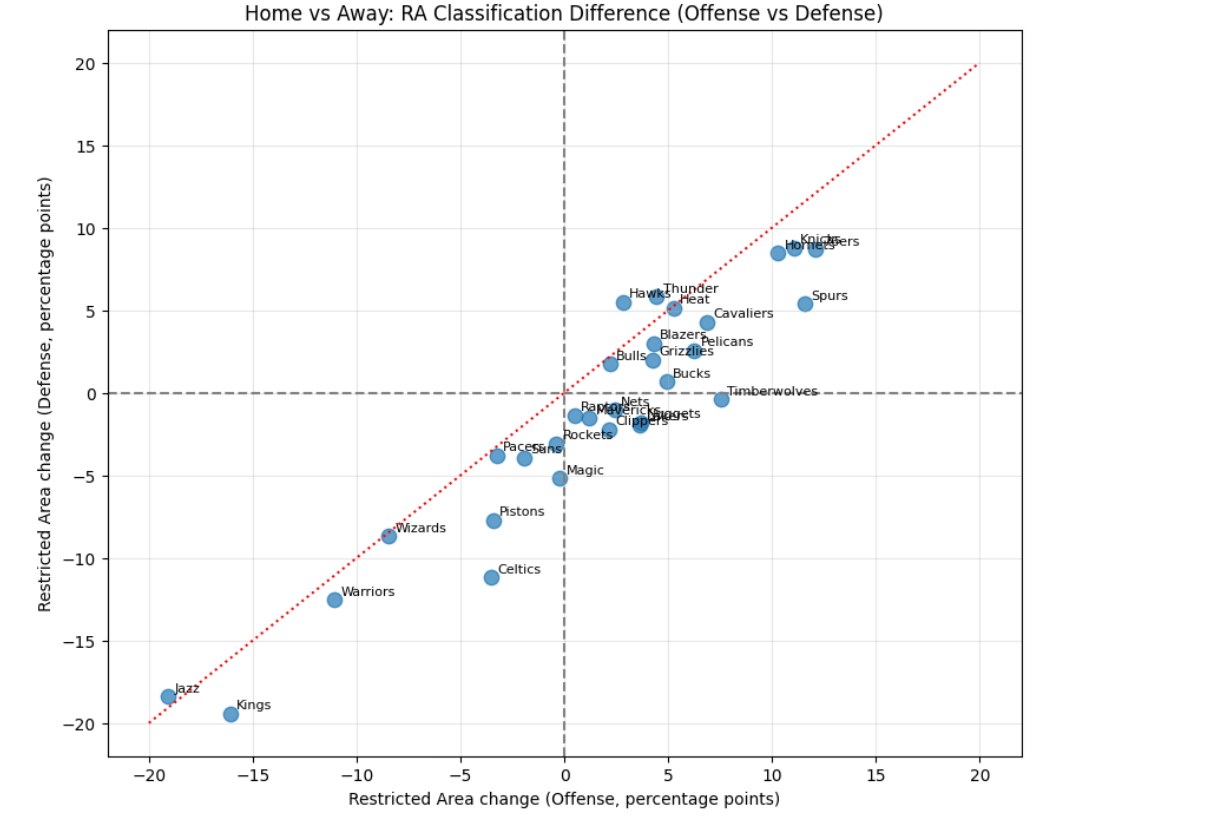
In the 2024–25 season, four arenas stood out: Utah, Sacramento, Golden State, and Washington. Each showed significantly fewer shots logged as RA for both offense and defense. The Jazz were the most extreme, with about 19 percentage points fewer RA shots recorded compared to league norms. The Kings were next at roughly 17–18 points low, followed by the Warriors (11–12 points low) and Wizards (around 8–9 points low). The symmetry is clear: both the home team and their opponents were equally “shortchanged” in RA classification, which rules out something like rim deterrence and points squarely to a scorer bias.
The scatter plot makes this visible. Teams like Utah and Sacramento sit far down the diagonal – depressed RA percentages on both the x-axis (offense) and y-axis (defense). Golden State and Washington aren’t as extreme but still well outside the main cluster of teams.
To correct for this, we apply an arena bias adjustment. In practice, this means making small tweaks to recorded shot distances in biased arenas. For instance, in Utah, a shot logged at 5 feet might be reclassified as a 4-footer, nudging it into the RA category. We only apply these corrections where the bias is large (roughly 7.5 percentage points or more), and the adjustments themselves are modest – typically half a foot or so. But those tweaks ensure that a Kevin Durant layup in Salt Lake City gets the same expected value as one in New York.
The result is a fairer model. Players aren’t rewarded or penalized based on quirks of the arena they play in, and our shot-making numbers reflect real performance rather than scorekeeper tendencies.
Putting It All Together: Blended Metrics and Normalization
Putting It All Together: Blended Metrics and Normalization
The final product of these upgrades is a blended shot-quality and shot-making model. It merges two sources: the detailed play-by-play context available in every season since 1996, and the richer tracking-based insights available from 2013 onward. When tracking data exists, the model incorporates it; when it doesn’t, it leans more on the play-by-play features. This blending keeps the metric continuous across eras without sudden jumps, while still squeezing out every bit of context the data can offer.
From this unified model, we calculate the same core outputs for every player and season:
Expected Points (xPTS): How many points an average shooter would have scored on the exact same set of shots.
Points Added (PA): The difference between a player’s actual points and their xPTS. Positive means they outperformed expectations (a shot-making boost), negative means they underperformed.
Shot_Making: A per-shot measure of PA, dividing the difference by field goal attempts. It’s essentially a volume-neutral indicator of how much a player adds or subtracts on each attempt compared to average.
PA_envNorm_blended: Points Added, adjusted for pace and league scoring environment. This normalization imagines every player operating in a league with ~100 possessions per game and an average offensive rating of ~110. It allows us to compare a slow, low-scoring season in the late 90s to today’s high-octane game on equal footing.
Shot_Making_blended: The per-shot version of the blended model. Because expectations are already set within each season’s environment, this metric is inherently cross-era comparable.
A few clarifications: we calculate everything separately for twos and threes, then combine for overall totals. Free throws are excluded, since the focus is purely on shots from the floor, though and-1 baskets still count toward points.
In short, the blended model gives us a clean, era-adjusted framework for answering the simple but slippery question: “How many points did this player add just by making (or missing) the shots they took?”
2024–25 Season: Top and Bottom Performers in Shot-Making
First, let’s look at the season that just finished (2024–25) and see which players added the most value with their shooting, and who had the roughest time. Remember, Points Added accounts for volume (making 100 extra tough shots adds more total value than making 10 extra tough shots), whereas Shot_Making looks at efficiency above expectation per attempt.
As expected, this list is loaded with star scorers. Nikola Jokić led the league in shot-making value added – his soft-touch floaters and efficient scoring at all levels contributed roughly +267 points above what an average shooter would have scored in his situations. Jokić’s ability to hit those one-legged 10-footers and awkward-angle hooks is finally getting full credit here. Kevin Durant comes in a close second at about +262. Durant’s mid-range marksmanship and three-level efficiency put him just behind Jokić despite playing fewer games. (Durant’s total means he scored about 262 points more than an average player would have from his shot attempts.)
Shai Gilgeous-Alexander, the MVP appears third. SGA lives in the mid-range and paint with an incredibly high conversion rate on what are tough looks for most players, giving him around +203 Points Added. Zach LaVine had a quietly stellar shooting year on a struggling Bulls team, ranking fourth (+188). And interestingly, Payton Pritchard cracks the top five – despite a more limited role in Boston, Pritchard was a flamethrower when he played, turning mostly open opportunities into made baskets at an absurd clip. We highlighted Pritchard in our last piece as a hidden gem, and here he is contributing roughly +162 points above expected in 2024–25 in his minutes off the bench. Essentially, he maximized his opportunities to an extreme degree.
Notably, we see a few non-All-Stars in this top 20. Ivica Zubac at +115 (ranked 15th) is a testament to efficient finishing; he doesn’t shoot outside of his lane, but around the rim he converted at rates well above an average big man. Norman Powell (+106) also appears – Powell was highly efficient on his mix of drives and catch-and-shoot chances. And Malik Beasley (+133) shows up in the top 10. Beasley, known as a streaky shooter, had one of his “on-fire” seasons in 2024–25. In Detroit’s system and playing off Cade Cunningham, he got a high volume of three-point looks and hit way more than expectation, vaulting him into this elite company. These guys aren’t primary options on their teams, but when they did shoot, they consistently punched above their weight. That’s exactly what this metric is designed to surface – players who add outsized value on the shots they take, even in smaller roles.
Now let’s check the other end of the spectrum:
This side of the ledger is dominated by young players. Alex Sarr and Stephon Castle had the two lowest PA totals in 2024–25, each around -143 points relative to expected. This list is filled with those who struggled mightily with their shot when they saw the floor. Other youngsters like Keon Johnson (–107) and Zaccharie Risacher (–66) also appear high on the list, emphasizing how steep the learning curve can be for young players adjusting to NBA shot difficulty.
There are a few veteran names as well. Russell Westbrook is present at about -74 points, meaning the shots he took yielded far fewer points than an average shooter would have produced. Westbrook’s well-documented shooting woes (especially from three-point range and at the rim) continue to hurt his efficiency – he underperformed expectations from virtually every spot on the floor. Kyle Kuzma is right there with him at -80; Kuzma withered away in Washington, and shot below expectation from nearly everywhere (particularly from deep and on contested attempts). Miles Bridges (–82) also had a rough shooting year in Charlotte, and Scottie Barnes (–78) appears, with his weaker finishing and outside shooting dragging him down. Even a star like Trae Young makes an appearance with -54, reflecting that his subpar three-point shooting in 2024–25 (combined with many difficult attempts) yielded fewer points than an average shooter would have with the same shots.
In summary, the 2024–25 snapshot shows that the elite shot-makers were a mix of the usual suspects (MVP-caliber players like Jokić, Durant, Curry, Giannis) and a couple of role-player sharpshooters having career years (Pritchard, Beasley, Powell). The lowest tier was heavily skewed toward rookies and young players who struggled to hit shots in their limited opportunities – a pattern we’ve seen before and that underscores how difficult it is to score efficiently at the NBA level right out of the gate. There were also some high-volume veterans whose cold shooting years cost their teams significant points (Westbrook, Kuzma, etc.).
What about pure efficiency, independent of volume? That’s where Shot_Making_blended (per-shot value added) comes in. It can highlight players who don’t take a ton of shots but make a disproportionate amount of them, as well as identify high-volume guys who were ultra-efficient when they did shoot. Here are the leaders and trailers in Shot_Making for 2024–25:
Kevin Durant tops this list – on a per-shot basis, he added about 0.233 points above expectation each time he shot, which is phenomenal over a season of high volume. That means almost a quarter of a point of added value on every field goal attempt. Vit Krejci appears at #3; even though he didn’t shoot nearly as often as others on the list, whenever he did, he was +0.195 points better than an average player. Krejci essentially turned decent looks into great outcomes at an incredible rate. Zach LaVine and Shai Gilgeous-Alexander show that their high total Points Added weren’t just due to volume – they were efficiently above expectation on each attempt, too. Giannis Antetokounmpo being up here might surprise some, but remember, the model expects most players to shoot ~60–65% at the rim in the heavily contested situations Giannis often faces; Giannis routinely pushes 70%+ at the rim. Each of his dunks or layups is expected to be a bit challenging, yet he converts them at an elite rate, hence the positive per-shot value (+0.09).
Interesting names like Keon Ellis and Daniel Gafford crack the top fifteen in Shot_Making. Gafford rarely shoots outside of dunks and put-backs, but when he does, he converts extremely well – better than other bigs, yielding +0.15 per attempt. When Keon Ellis shot the ball, he was selective and effective, often benefiting from good looks and then converting at rates higher than baseline. It’s a good reminder that you don’t have to be a superstar to contribute elite-level shot-making in a given season. Role players can shine in this metric by maxing out their opportunities.
On the flip side, here are the Bottom 20 Shot_Making figures in 2024–25 – the players who, on each attempt, underperformed the expected value by the largest margin:
This list, like the Points Added one, is stacked with rookies and young players adjusting to the NBA game. Cody Williams had the steepest per-shot decline at -0.286, meaning each of his attempts cost nearly three-tenths of a point compared to what an average shooter would’ve produced. Tidjane Salaün (-0.256), Jonathan Mogbo (-0.255), and KJ Simpson (-0.253) weren’t far behind, all showing that their shot diets and finishing efficiency put them well below the league baseline. These aren’t small gaps - being that far under expectation on every attempt quickly adds up to major negatives in total value.
Kris Murray (-0.228) and AJ Johnson (-0.226) also fell deep into the red. Ricky Council IV (-0.209) and Jonathan Isaac (-0.192) continued the trend; Isaac’s defense has always been his calling card, but on offense, his inability to hit shots at even average levels really stands out in this model.
Some veterans also make appearances. Andre Drummond (-0.179) has long been limited offensively outside the paint, and here he grades as one of the weakest shot-makers among regulars. Alex Sarr (-0.173) and Stephon Castle (-0.145), both high-profile rookies, landed among the bottom tier as well, reminding us how steep the NBA learning curve can be for young bigs and guards alike. Orlando Robinson (-0.171), Bruce Brown (-0.167), and Javonte Green (-0.161) show how even rotational players with some experience can struggle to stay above water when forced into larger offensive roles.
Further down the list, names like Noah Clowney (-0.158), Dalano Banton (-0.152), and Bilal Coulibaly (-0.151) highlight how difficult it is for developing players to maintain efficiency against NBA defenses. Precious Achiuwa (-0.149) and Clint Capela (-0.144) round out the group - both frontcourt players who bring value elsewhere but whose shot-making efficiency, when isolated, drags behind expectation. Bigs who struggle to finish at the rim tend to be the weakest performers here, since their diet tends to consist of the “easier” looks.
The consistent theme is clear: heavy representation from rookies and second- or third-year players still finding their footing, plus a handful of veterans with well-known offensive limitations. These numbers illustrate not just poor efficiency, but specifically underperformance relative to the types of shots they took. In other words, it wasn’t just that these players were missing hard shots - they often missed ones that the average NBA player would convert more reliably.
All-Time Leaderboards (1996–2025)
One of the exciting parts of this blended model is the ability to look back at historical seasons and compare shot-making across eras on an apples-to-apples basis. We’ve normalized everything for pace and environment, so a season from 1997 can stand next to one from 2023 on equal terms. Let’s dig into the best and worst single-season performances in shot-making since 1996–97.
It comes as no surprise that 2015–16 Stephen Curry sits at the top – and by a mile. That season, Curry was otherworldly, shattering the record for threes made (402) at high efficiency, and hitting countless off-the-dribble bombs from well beyond the arc. Our model confirms it as the gold standard of shot-making impact: roughly +397 points added (after pace and era normalization). To put that in perspective, Curry essentially contributed nearly 10 extra points per game above an average shooter just from his shot-making. It’s the kind of season that redefined what a “good shot” means in basketball.
Next is 1999–2000 Shaquille O’Neal at about +330 points. Shaq’s MVP season with the Lakers was a tour de force of interior scoring. He was so dominant around the basket that even though dunks and layups are high-percentage looks, he still exceeded the league’s expected conversion rates by a huge margin (and did it on massive volume). In an era with limited spacing, multiple big men on the floor, and increased physicality, Shaq stood alone at the topd. Shaq appears again at #5 with his 2000–01 season (~+281). Seeing two Shaq seasons in the top five is a great reminder that extreme efficiency in the paint can rival the impact of extreme efficiency from three. Shaq essentially bent the expected value model by living at ~60–70% shooting on huge usage, which very few players could do.
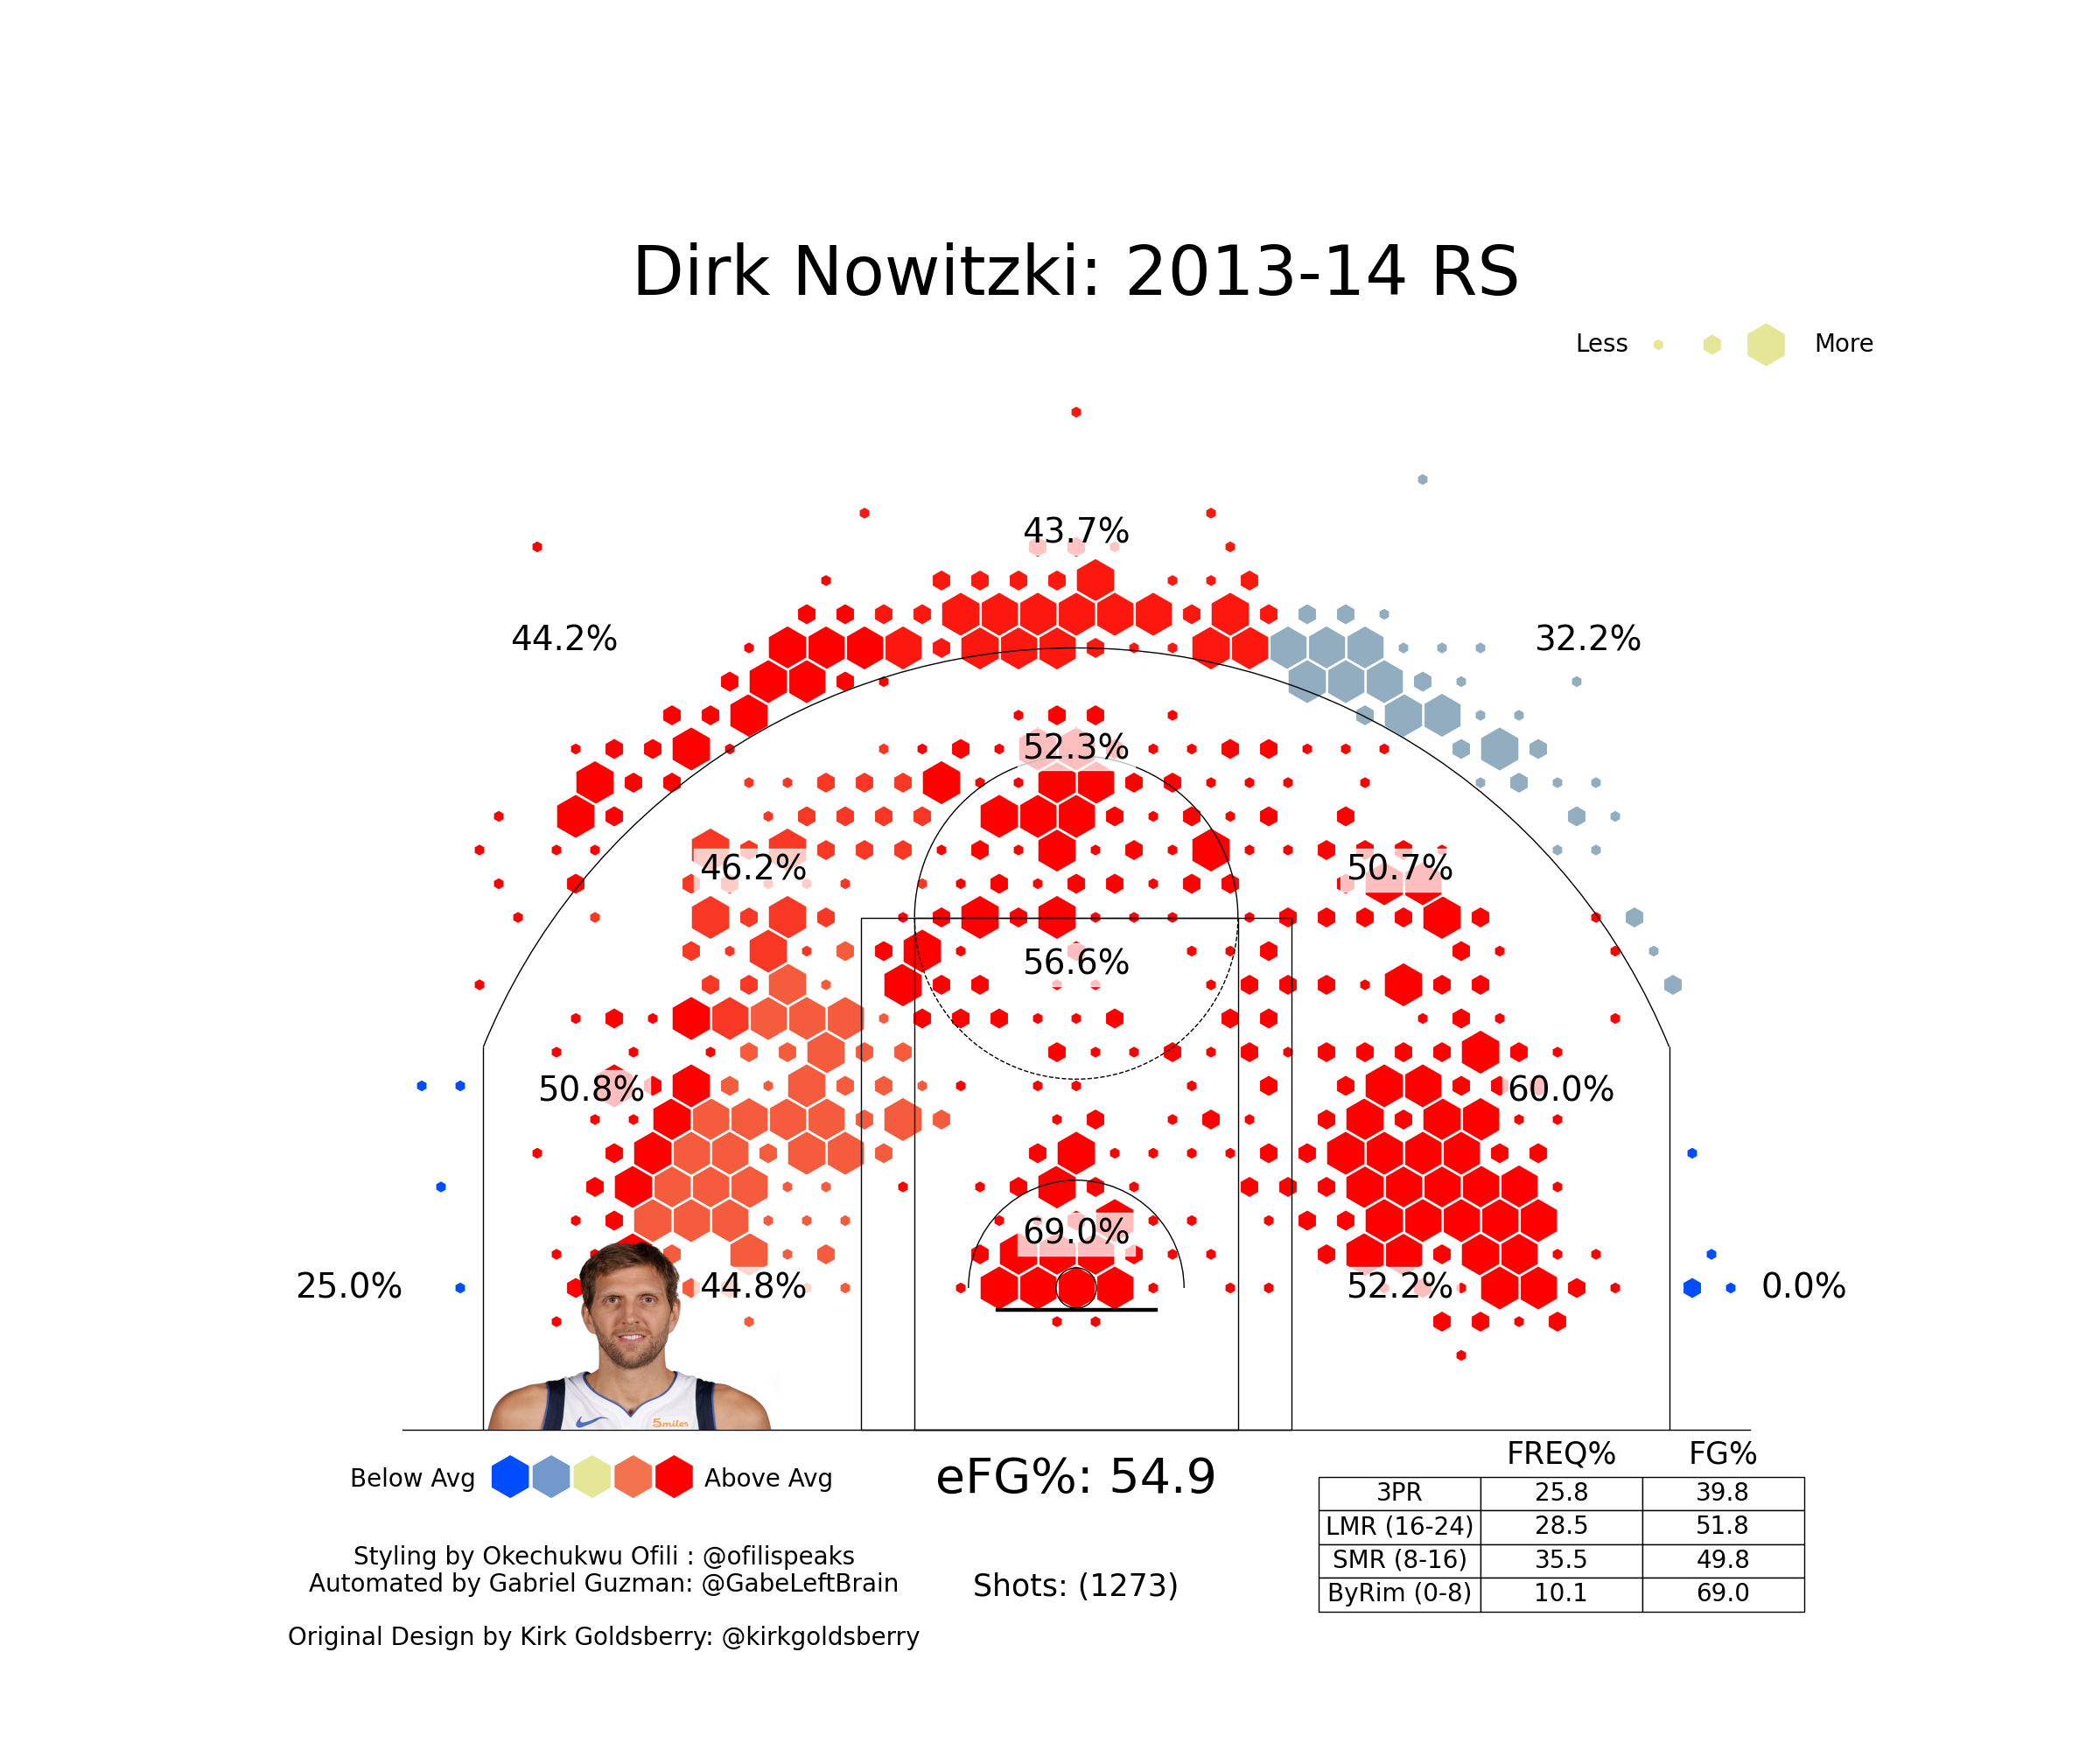
At #3, we have 2013–14 Dirk Nowitzki (+301). That year Dirk shot 49.7% from the field, 39.8% from three, and 89.9% from the line – an absurd shooting slash for a big man taking many long jumpers. He consistently made contested fadeaways that most players would miss, so his Points Added is enormous. Dirk was a precursor to this era’s shot-making explosion: a seven-footer who took and made very difficult shots look routine.
#4 is 2013–14 LeBron James (+283), one of LeBron’s most efficient seasons (56.7% FG, including a 37.9 % from three). LeBron wasn’t taking the sheer volume of threes that Curry or Durant did, but he eliminated many low-value shots from his diet that year and hit an unreal percentage of his mid-range attempts. So even though LeBron is more known for his all-around game than pure shooting, that season’s shot-making stands as one of the best ever.
We also see a few other notable names: Kevin Garnett (2003–04) shows up at ~238 points – his MVP season. People often remember KG first and foremost for his defense, leadership, and intensity, but it’s easy to forget that he was also one of the best shooting bigs of his era. He lived at the elbows and the top of the key, where his high release and soft touch made him a nightmare. The shot map from that season highlights just how reliable his jumper was, paired with strong finishing inside.
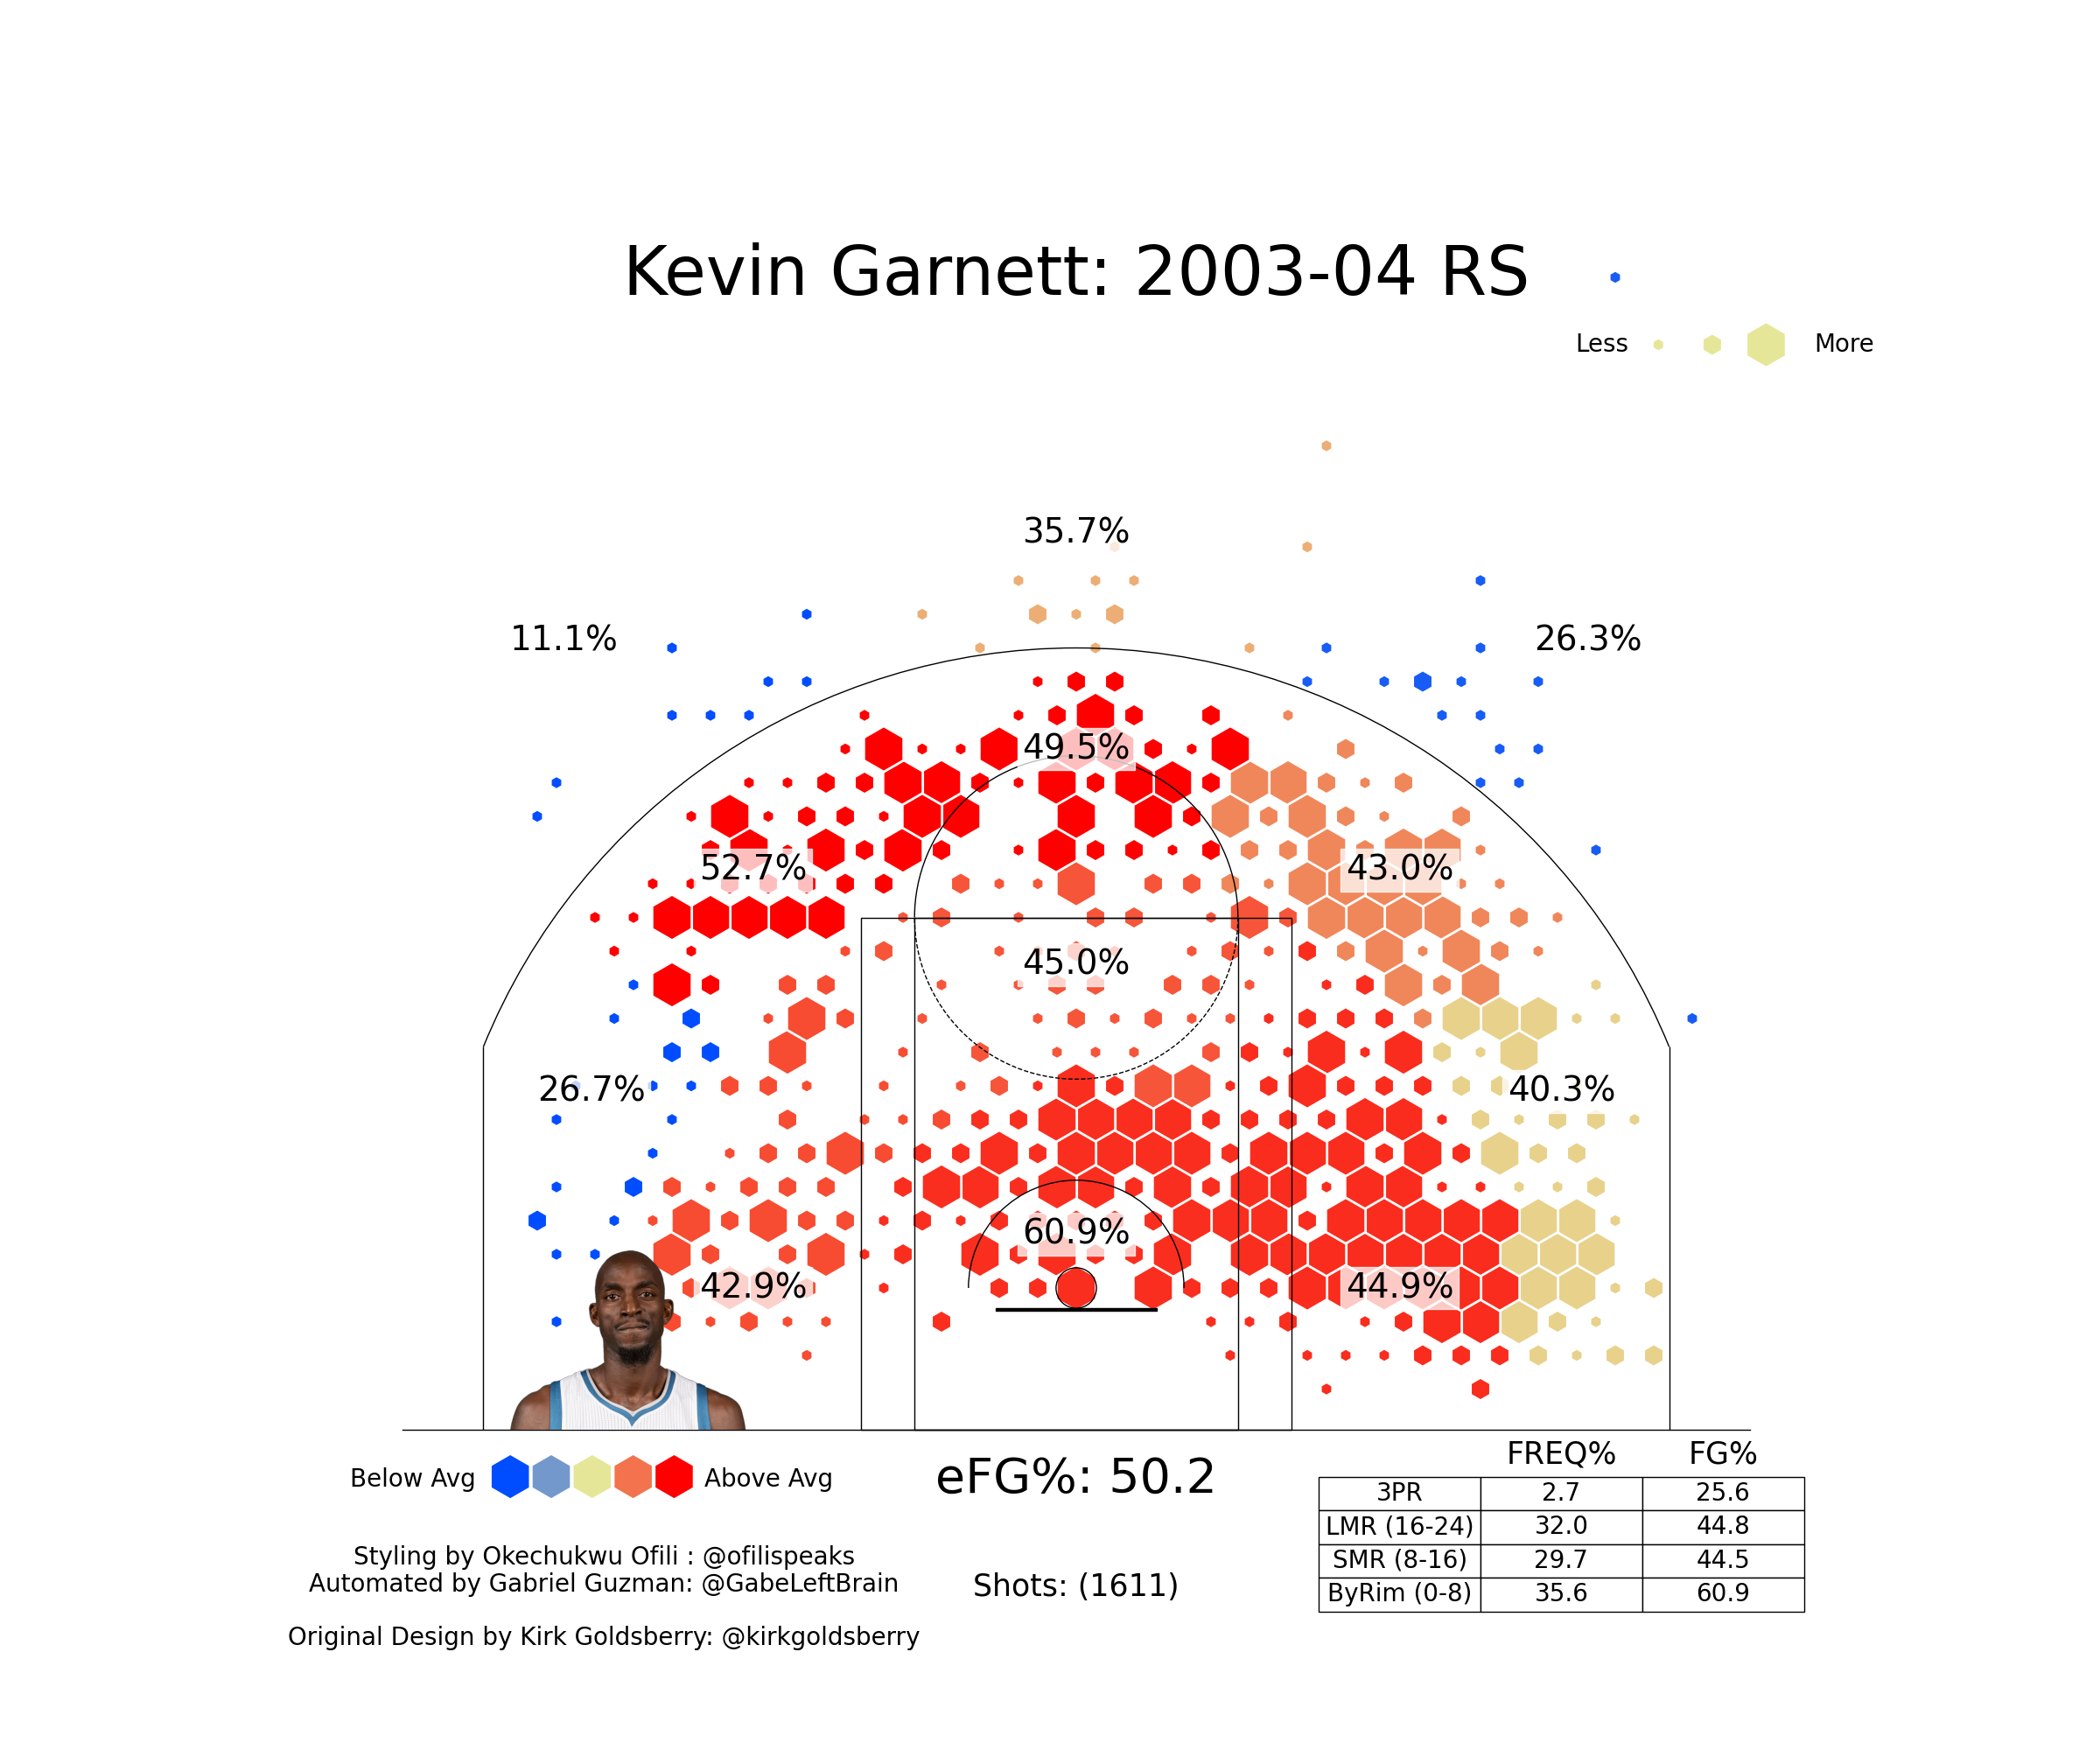
Part of why his shooting doesn’t always get celebrated is timing: Garnett’s career overlapped with Dirk Nowitzki’s, and Dirk redefined what people thought a “shooting big” could be. But KG deserves to be remembered not just as an all-time defender, but as a big man who could score from anywhere on the floor and bend defenses with his outside shooting.
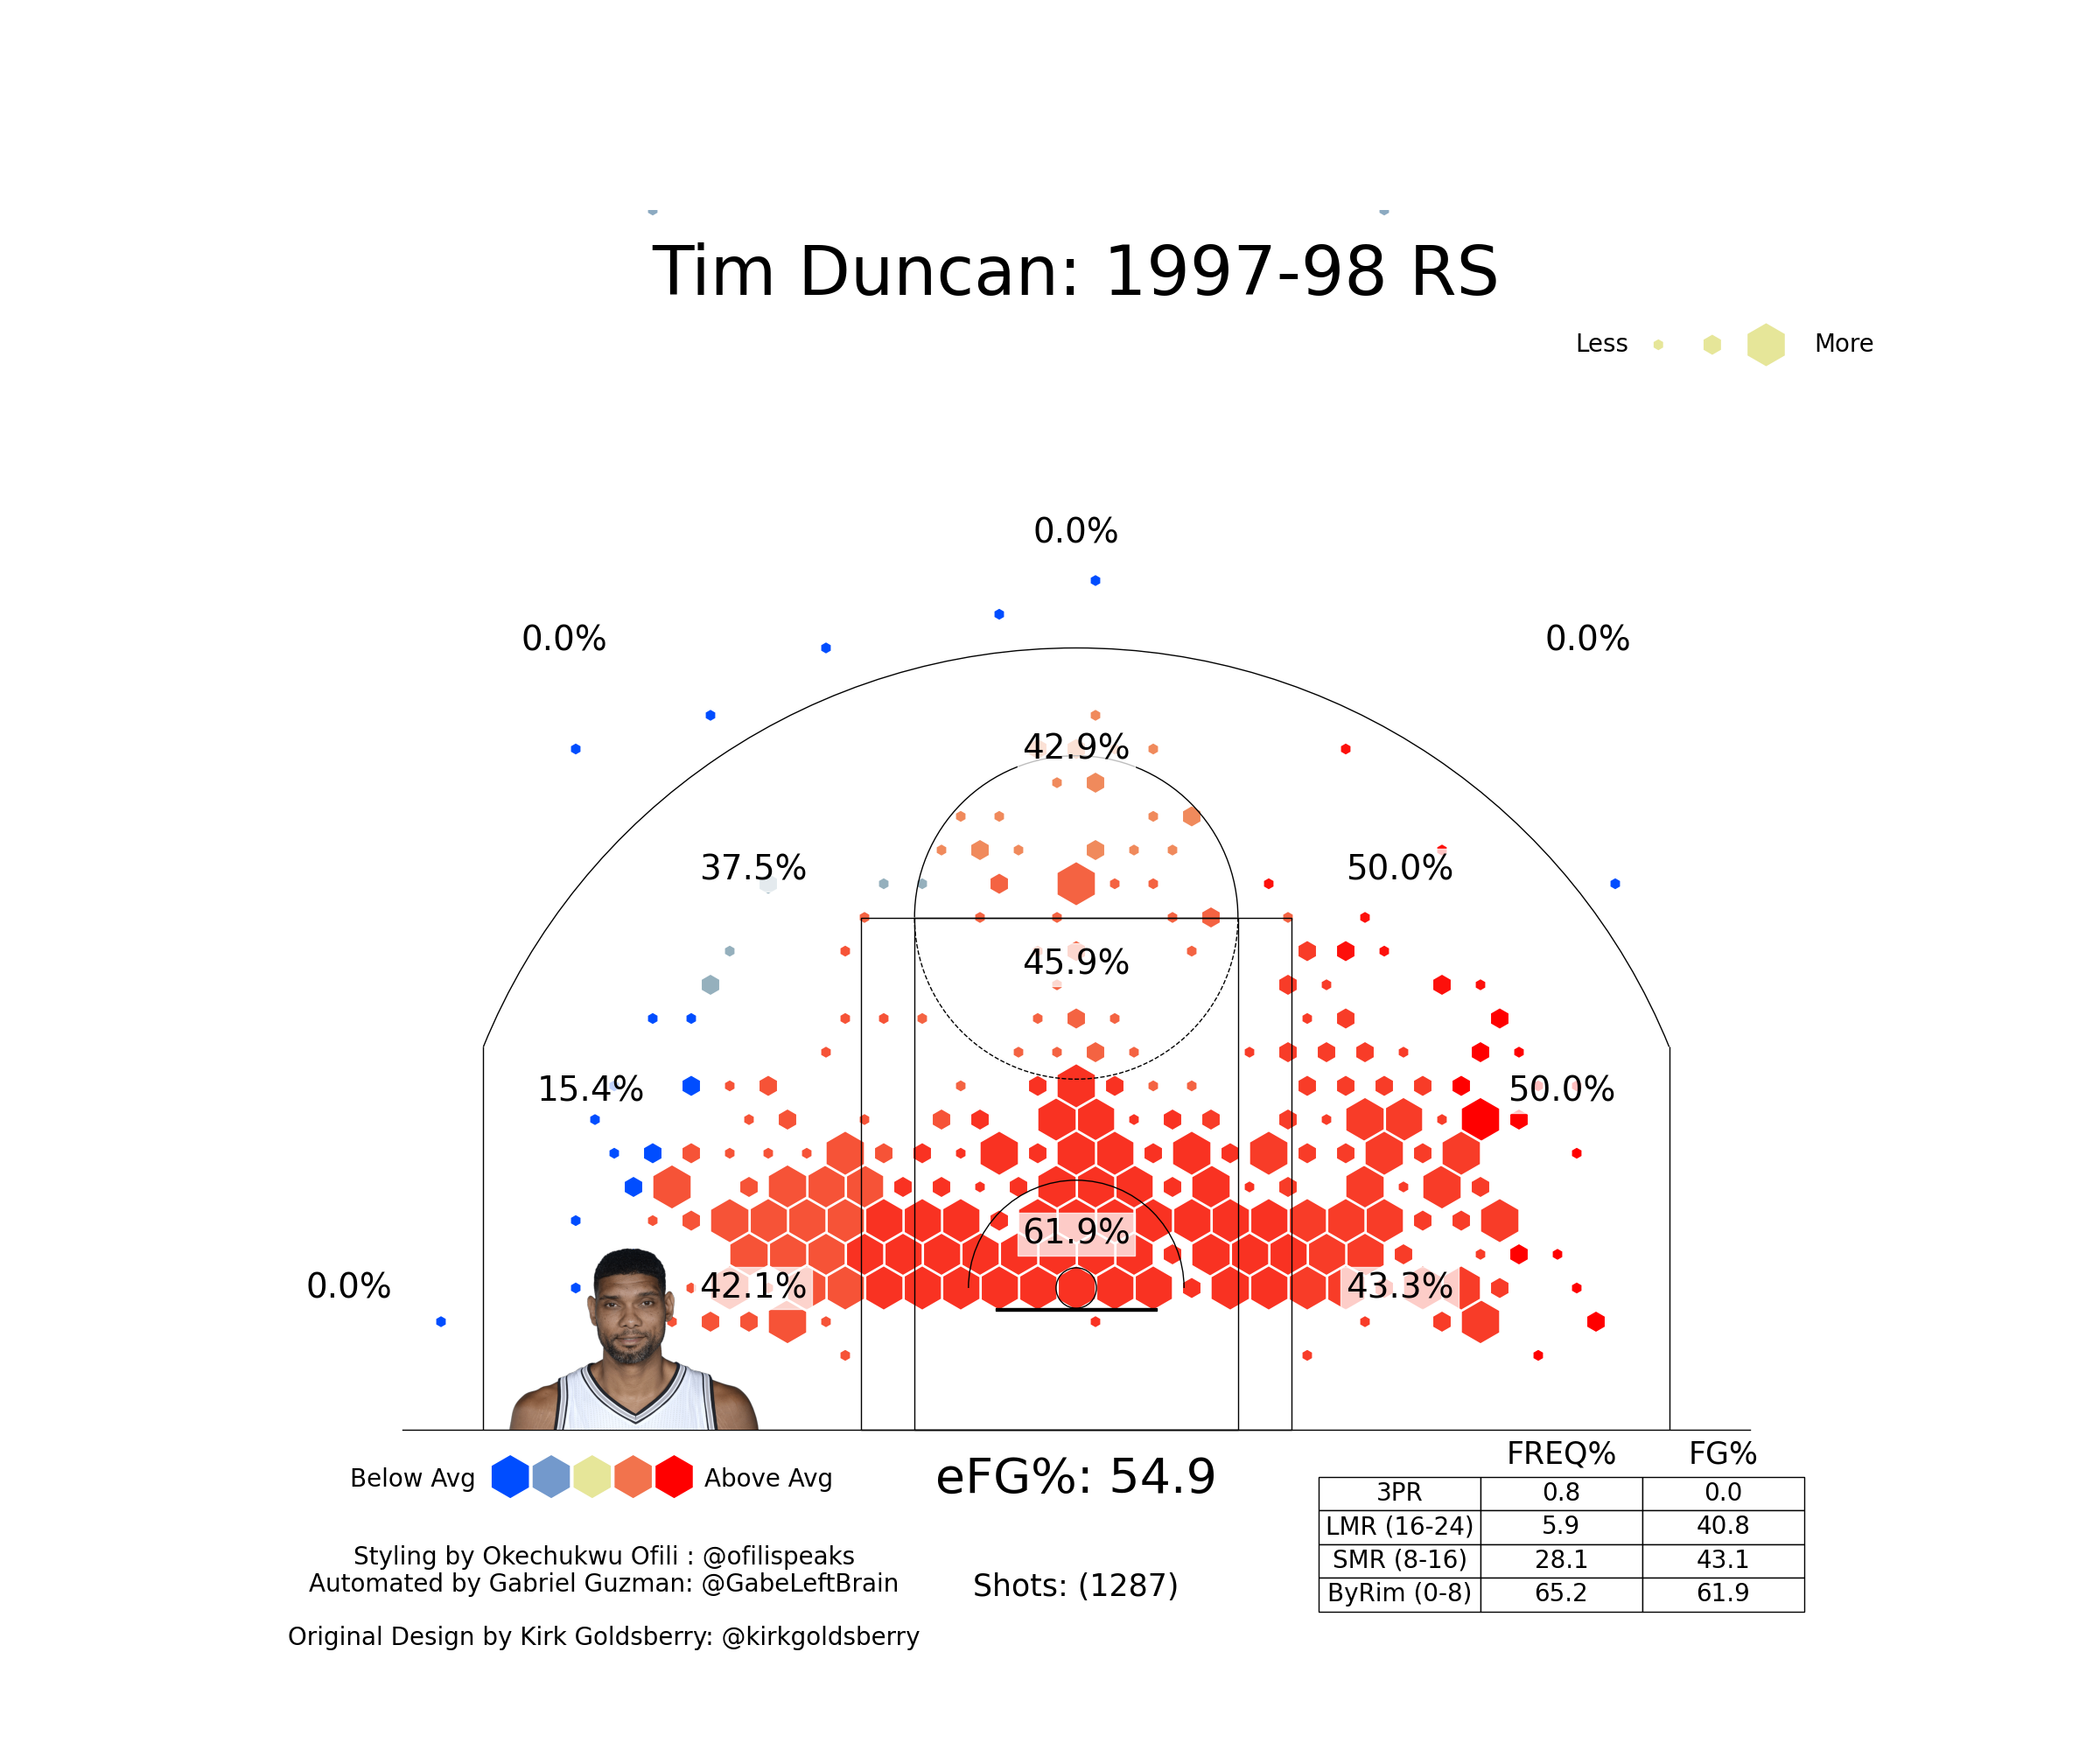
Tim Duncan also appears here with his rookie year (1997–98, +232), which might surprise you until you recall rookie Duncan shot 54% on a high volume of bank shots and post moves in a slower-paced era – he was immediately elite at converting his chances.
Overall, the top-tier seasons reinforce what the eye test tells us: Curry’s greatest season was unlike anything we’ve seen, Durant and Dirk are mid-range maestros, prime LeBron was a monster driver, and Shaq was basically cheat-code efficient at the rim. Different styles, all yielding tremendous value above normal.
Now, the Bottom seasons in Points Added since 1996–97 – these are seasons where players cost their teams the most points by shooting worse than expectation:
Bottom 20 Seasons – Points Added (since 1996–97, normalized):
It’s immediately apparent that many of the worst seasons are from players’ early careers or from notorious high-volume chuckers. The single lowest Points Added season on record is Antoine Walker’s rookie year (1996–97) at roughly -209 points. As a rookie on a bad Celtics team, Walker was given the green light, and he fired away inefficiently (he shot under 43% while taking a ton of long twos and threes). Our model essentially says he cost his team over 200 points that an average shooter would have provided with the same shot diet – an enormous hole to dig. Walker also appears with his 2001–02 season at -154, highlighting that this was somewhat his MO (high volume, low efficiency) throughout the early 2000s.
Next is 2008–09 Russell Westbrook at about -201, which was Westbrook’s rookie year. Young Russ struggled with his jumper (as he would throughout his career) and shot only 39.8% overall. He also took a lot of mid-range shots. The result was a huge negative Points Added. In fact, Westbrook’s first three seasons (2008–2011) are all in the bottom 15. This illustrates how even as he improved as a player, his shot selection and accuracy lagged – he was essentially a net negative shooter early on, despite his athletic talent.
Jerry Stackhouse shows up three times in the worst 20 (1996–97, 1999–2000, 2000–01). Stackhouse led the league in scoring in 2000–01 with 29.8 PPG, but did so extremely inefficiently (he shot 40% on massive volume). The model pegs that season at -162 PA – meaning despite scoring nearly 30 a night, Stack underperformed the expectation of those shots by a huge margin. It’s a classic example of volume not equaling efficiency. His 1996–97 and 1999–2000 seasons were similar storylines: high usage, poor percentages.
We also see Shawn Kemp 1999–2000 (-168). By 1999, Kemp was in Cleveland and far from his peak shape, yet he was still taking a lion’s share of shots – with bad results (he shot just 41% that year). Stephon Marbury 1997–98 (-153) appears; that was Marbury’s sophomore season in Minnesota, where he jacked up a lot of shots at 41% from the field. Monta Ellis 2012–13 (-149) is another notorious case: Monta was a dynamic scorer, but in his Milwaukee season, he shot 41.6% and took many low-value long twos, leading to this big deficit.
A few recent names pop up, too. Luguentz Dort 2022–23 (-162) was an example of a player asked to expand his offensive role without the efficiency to back it up (Dort shot just 38.7% overall and 33% from three that year for OKC). RJ Barrett 2021–22 (-149) shows that his third year in New York was pretty rough shooting-wise (he was below expected from virtually all ranges, especially from three). Marcus Smart 2016–17 (-149) highlights how early-career Smart was a very poor shooter (he hit under 30% from three that year on high attempts). And Carmelo Anthony’s rookie year (2003–04) also sneaks in at -149 - young Melo scored a lot (21 PPG) but was inefficient (42.6% FG, 32% 3PT), which puts him here.
It’s important to remember that this list is isolating shot-making, not measuring a player’s total offensive value. Players like Allen Iverson carried massive scoring loads, and that gravity alone created opportunities for their teammates. Even if their individual shot-making comes out negative in this model, that doesn’t mean they were net-negative offensive players. What it does mean is that, strictly as shooters, they fell short of what would be expected on the same shot diet.
That’s the double-edged sword of high usage. A transcendent shooter can add 300–400 points over the course of a season, but a volume scorer who struggles with efficiency can lose 150–200 points for his team. Iverson is a prime example: he shows up here with -159 in 2002–03 and -156 in 1996–97, and had other seasons in the -100 range. On one hand, the model is bluntly saying “an average shooter would have scored more points with Iverson’s shot profile.” On the other hand, context matters: Iverson was facing set defenses geared to stop him, his penetration opened up kickouts and put pressure on the rim, and his ability to draw fouls (not included in this metric) was elite. Those elements made him a more valuable offensive engine than the shot-making number alone would suggest.
So while the worst-of list highlights who bled the most value purely through inefficient shot-making, it shouldn’t be mistaken for a ranking of the league’s worst offensive players. Instead, it’s a reminder of the stakes: the higher the usage, the more a player’s efficiency (or lack of it) ripples through a team’s scoring output.
Finally, let’s consider the per-shot seasons across eras. Who has the highest Shot_Making (per attempt) in a single season, and who has the lowest?
It’s a familiar cast at the very top: Stephen Curry, Kevin Durant, Dirk Nowitzki, and Nikola Jokić dominate the leaderboard. The single highest per-shot season on record (minimum ~750 attempts) belongs to Kevin Durant in 2022–23 (+0.277). That year, KD was on another planet - essentially 55/40/90 splits while taking a steady diet of contested midrange shots. Every attempt was worth nearly three-tenths of a point above league expectation, edging out even the best of Curry.
2015–16 Curry (+0.257) comes next, and the context makes it even crazier: he did it on 1,575 attempts. Maintaining that efficiency across that volume is unprecedented. Those two seasons, KD 2023 and Curry 2016, stand alone above the +0.25 mark, the statistical equivalent of a mountaintop only two climbers have ever reached.
Behind them, we see the +0.23 to +0.24 cluster: 2022–23 Jokić (+0.241) during his MVP-caliber campaign, 2013–14 Dirk (+0.240) showing his vintage top-of-the-key dominance, and 2024–25 Durant (+0.239) proving that even in his mid-30s, he’s still one of the most efficient shot-makers alive.
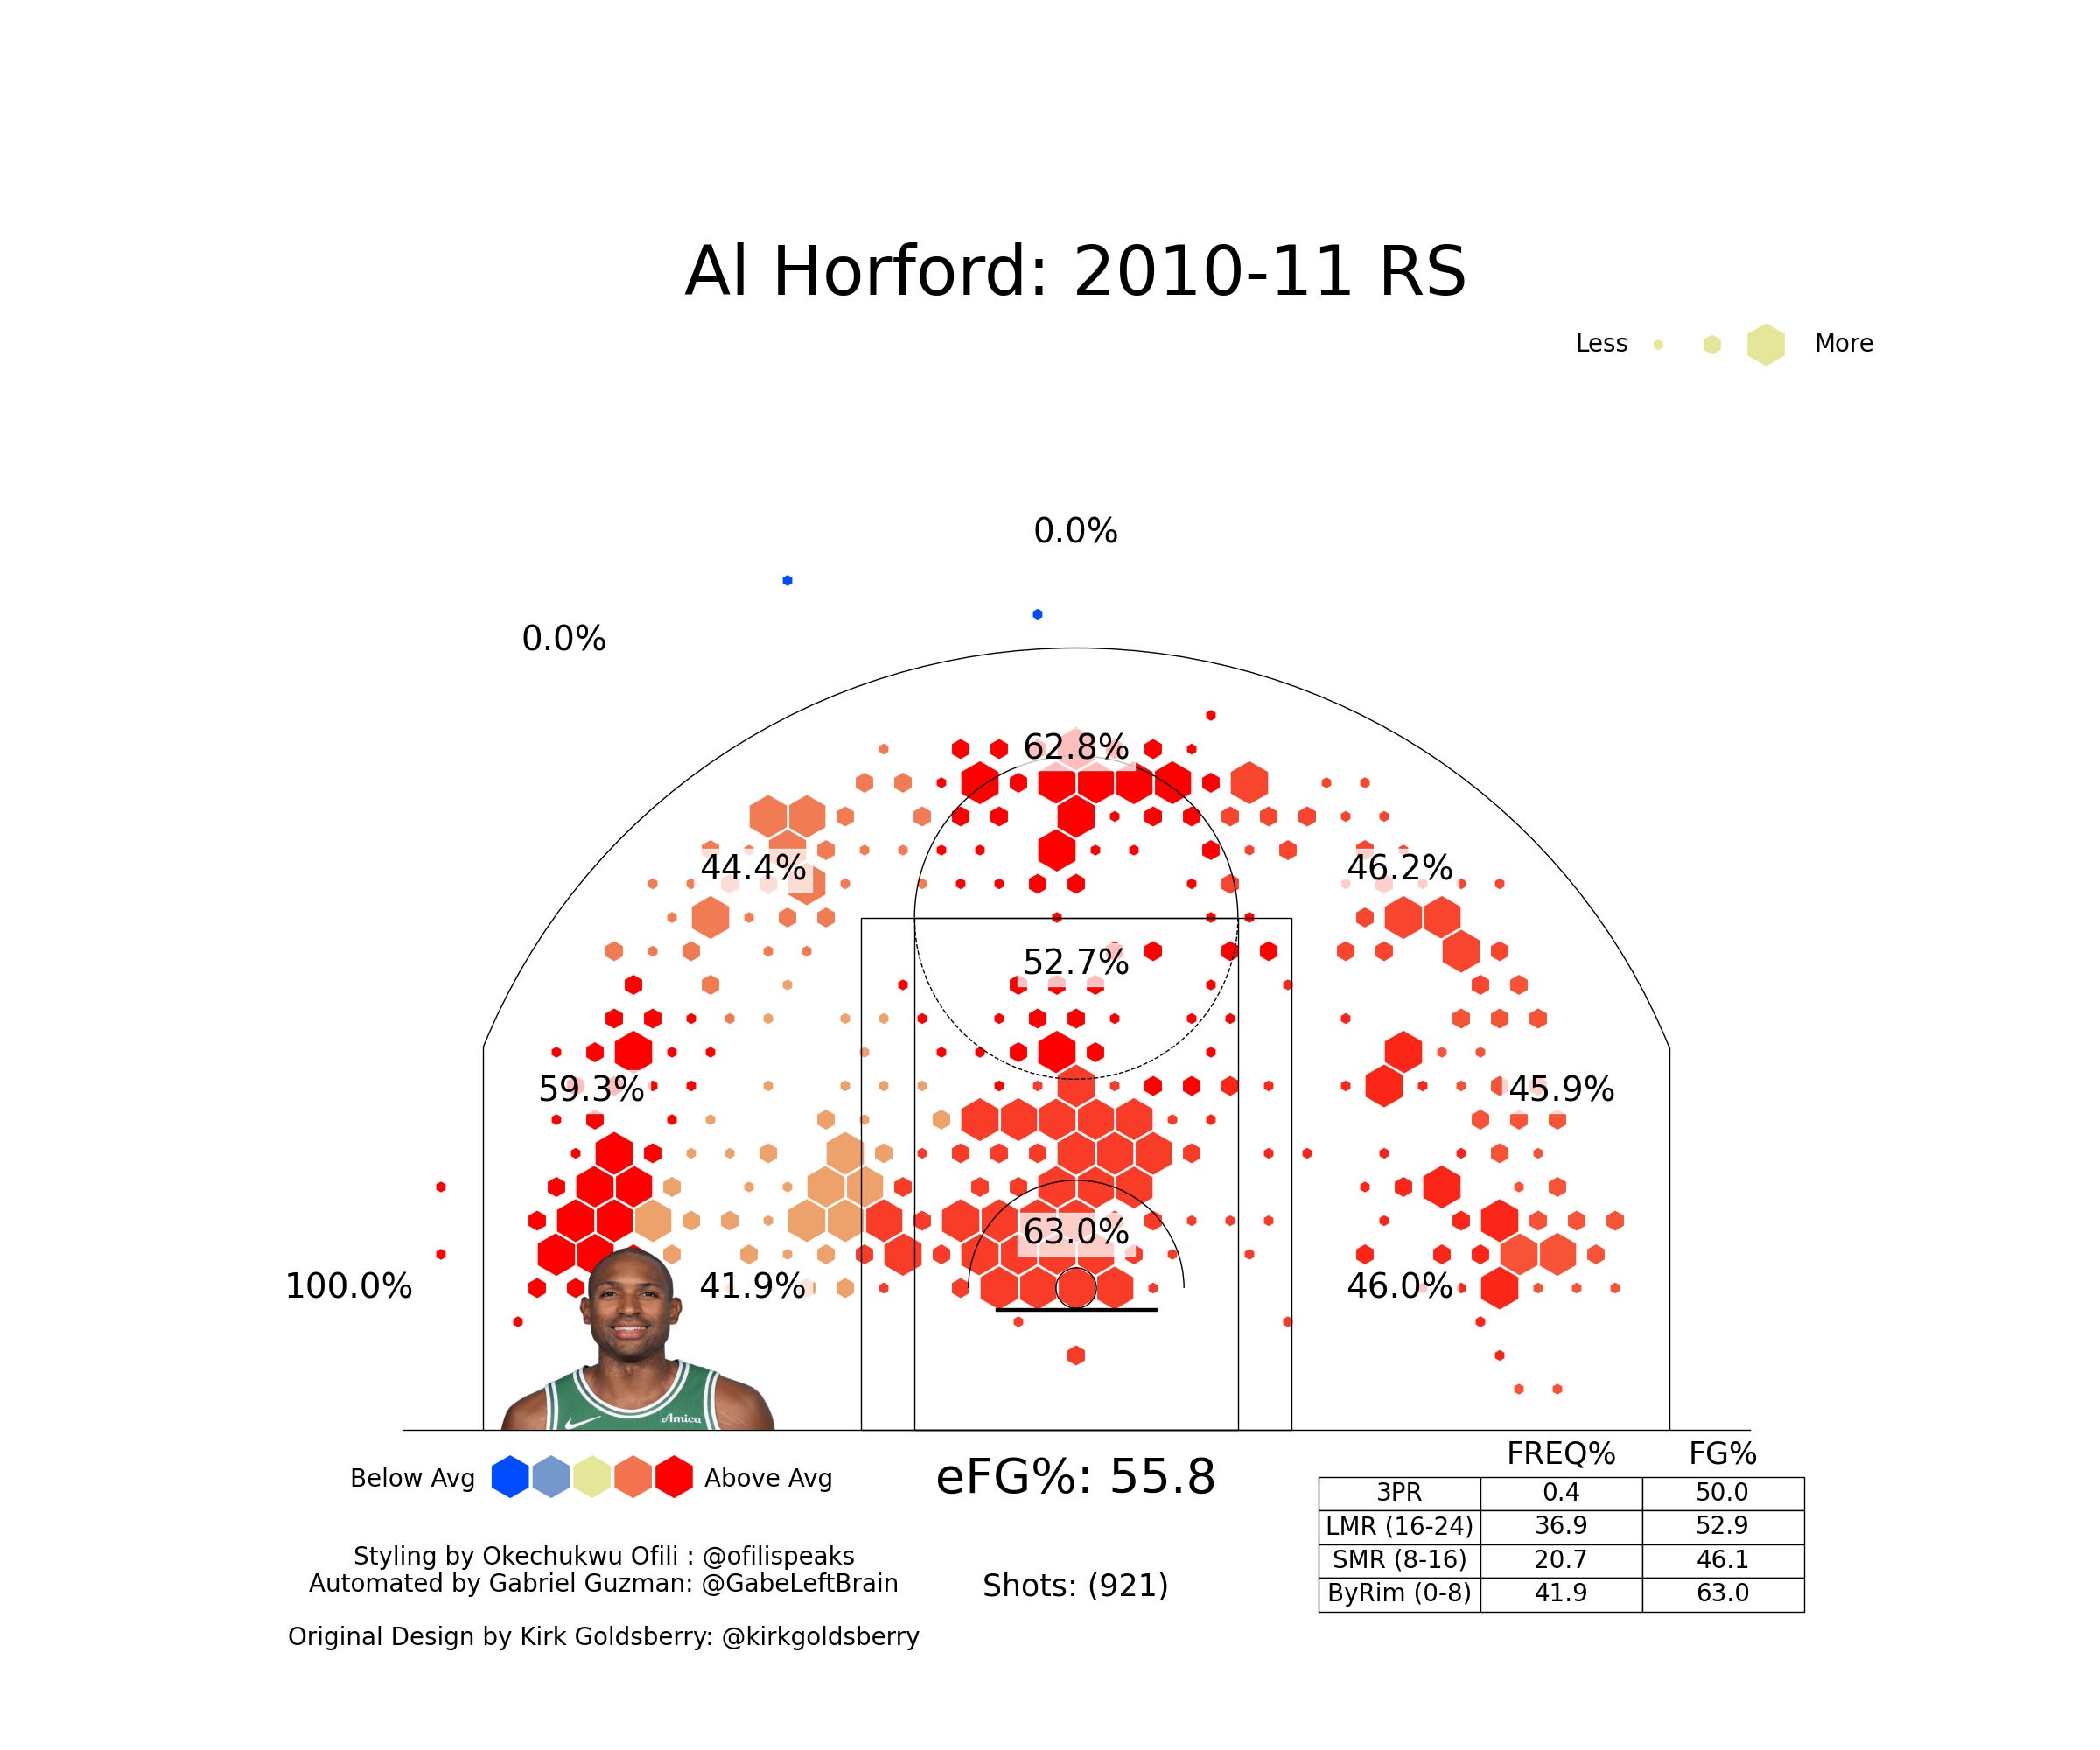
Big men also crack the list. Shaquille O’Neal appears three separate times, including +0.226 in 2004–05 and +0.210 in the lockout-shortened 1999 season. For Shaq, “shot-making” meant converting at-the-rim attempts better than anyone else ever could, often through contact, often for three-point plays. Dwight Howard (2009–10, +0.197) and Al Horford (2010–11, +0.199) also sneak in, the latter a surprise - Horford’s blend of pick-and-pop jumpers and interior finishing translated into one of the most efficient per-shot seasons of the modern era.
There are elite guards and wings sprinkled throughout: Steve Nash has two seasons above +0.22, LeBron James 2013–14 (+0.213) is his personal high-water mark, and JJ Redick 2015–16 (+0.209) rode his off-ball movement and catch-and-shoot mastery to land in all-time company. Chris Mullin’s 1996–97 (+0.204) is another historical gem: at 33 years old, in a low-efficiency era, he shot 50/44/87 for Golden State.
A handful of other Curry, Durant, and Jokić seasons fill out the list around the 0.20–0.21 mark. Together, they tell the same story: the very top per-shot seasons either come from all-time tough-shot creators (Curry, Durant, Dirk), hyper-selective precision shooters (Nash, Redick, Horford), or interior finishers who bent the rim to their will (Shaq, Dwight, LeBron).
Now for the worst Shot_Making seasons since 1996–97 – the most abysmal per-shot performances (minimum 750 FGA):
At the other end of the spectrum, the worst per-shot seasons highlight just how damaging inefficient volume can be. The lowest on record with significant attempts belongs to Alex Sarr in 2024–25 (-0.218). As a rookie, he was thrust into a big role and simply wasn’t ready offensively. Every attempt he took bled more than two-tenths of a point compared to league average a staggering gap that underlines how steep the NBA learning curve can be.
Right behind him is Luguentz Dort in 2022–23 (-0.211), a year where his defensive value couldn’t mask how rough his shot profile was. Dort was asked to do more offensively than he should have, and the result was a black hole season by this model. Rookie Russell Westbrook in 2008–09 (-0.190) also lands near the top. His raw athleticism was clear, but the jumper and finishing weren’t yet there, so the numbers show just how inefficient he was out of the gate.
John Wall’s first two seasons (2010–11 at -0.169 and 2011–12 at -0.164) tell a similar story: elite speed and playmaking, but jump shooting that lagged far behind. Antoine Walker’s rookie season (1996–97, -0.162) is here as well, confirming his reputation as a high-volume, low-efficiency gunner. Tony Wroten’s 2013–14 (-0.159) is another example - a backup guard in Philly who relentlessly attacked but shot 21% from three and under 40% overall, making him one of the most inefficient scorers in the league. Scoot Henderson’s 2023–24 (-0.157) season joins them, reflecting the brutal realities of a rookie year where he shot under 40% from the field and under 30% from deep.
There’s a mix of veterans and young hopefuls scattered through the list. Vernon Maxwell in 1996–97 (-0.155), at the tail end of his career, kept firing but couldn’t connect. Baron Davis in 2008–09 (-0.154) mailed in a season for a tanking Clippers team, shooting 37%. Josh Jackson (2017–18, -0.155) and Jason Williams (1999–00, -0.153) both fit the rookie-miscast mold - tons of flair and opportunity, but not enough efficiency to justify it.
Larry Hughes appears twice: -0.152 in 2007–08 with Chicago and -0.145 in 2000–01 with Golden State. His reputation as a volume shooter who struggled to hit league-average rates shows up clearly in the numbers. Other names like Jerry Stackhouse (1996–97, -0.151), Raymond Felton (2006–07, -0.147), Brandon Jennings (2010–11, -0.146), and Shawn Kemp (1999–00, -0.146) reinforce the theme of chucking without converting. Even Emmanuel Mudiay (2015–16, -0.144) and Lou Williams (2008–09, -0.142) appear here, each saddled with poor efficiency in high-usage guard roles.
The throughline is clear: the worst per-shot seasons are dominated by rookies and young guards thrust into responsibility they weren’t ready for, plus a few veterans with reputations for inefficient scoring. Context matters - many of these guys were on bad teams or were asked to do too much. Still, the model quantifies the cost: just as elite shooters can add 300–400 points in a season, inefficient volume scorers can burn through 150–200 points, dragging down team offense even while carrying the load.
Under-the-Radar Standouts
Not all the standouts on this list are MVPs or perennial All-NBA guys. Two seasons worth highlighting are Sam Cassell’s 2003–04 and Elton Brand’s 2005–06, both of which show up as historically strong shot-making years despite not always getting the same shine as the Currys, Dirks, or Durants.
Cassell’s 2004 season (+0.168 Shot_Making, +209 PA_envNorm) was part of the backbone of the Timberwolves’ Western Conference Finals run. Playing next to Kevin Garnett in his MVP season, Cassell gave Minnesota a lethal secondary scorer who could punish defenses from mid-range and late-clock situations. His shot map that year shows just how comfortable he was at pulling up from all over the arc of the foul line, and he converted those shots at rates far above league average.
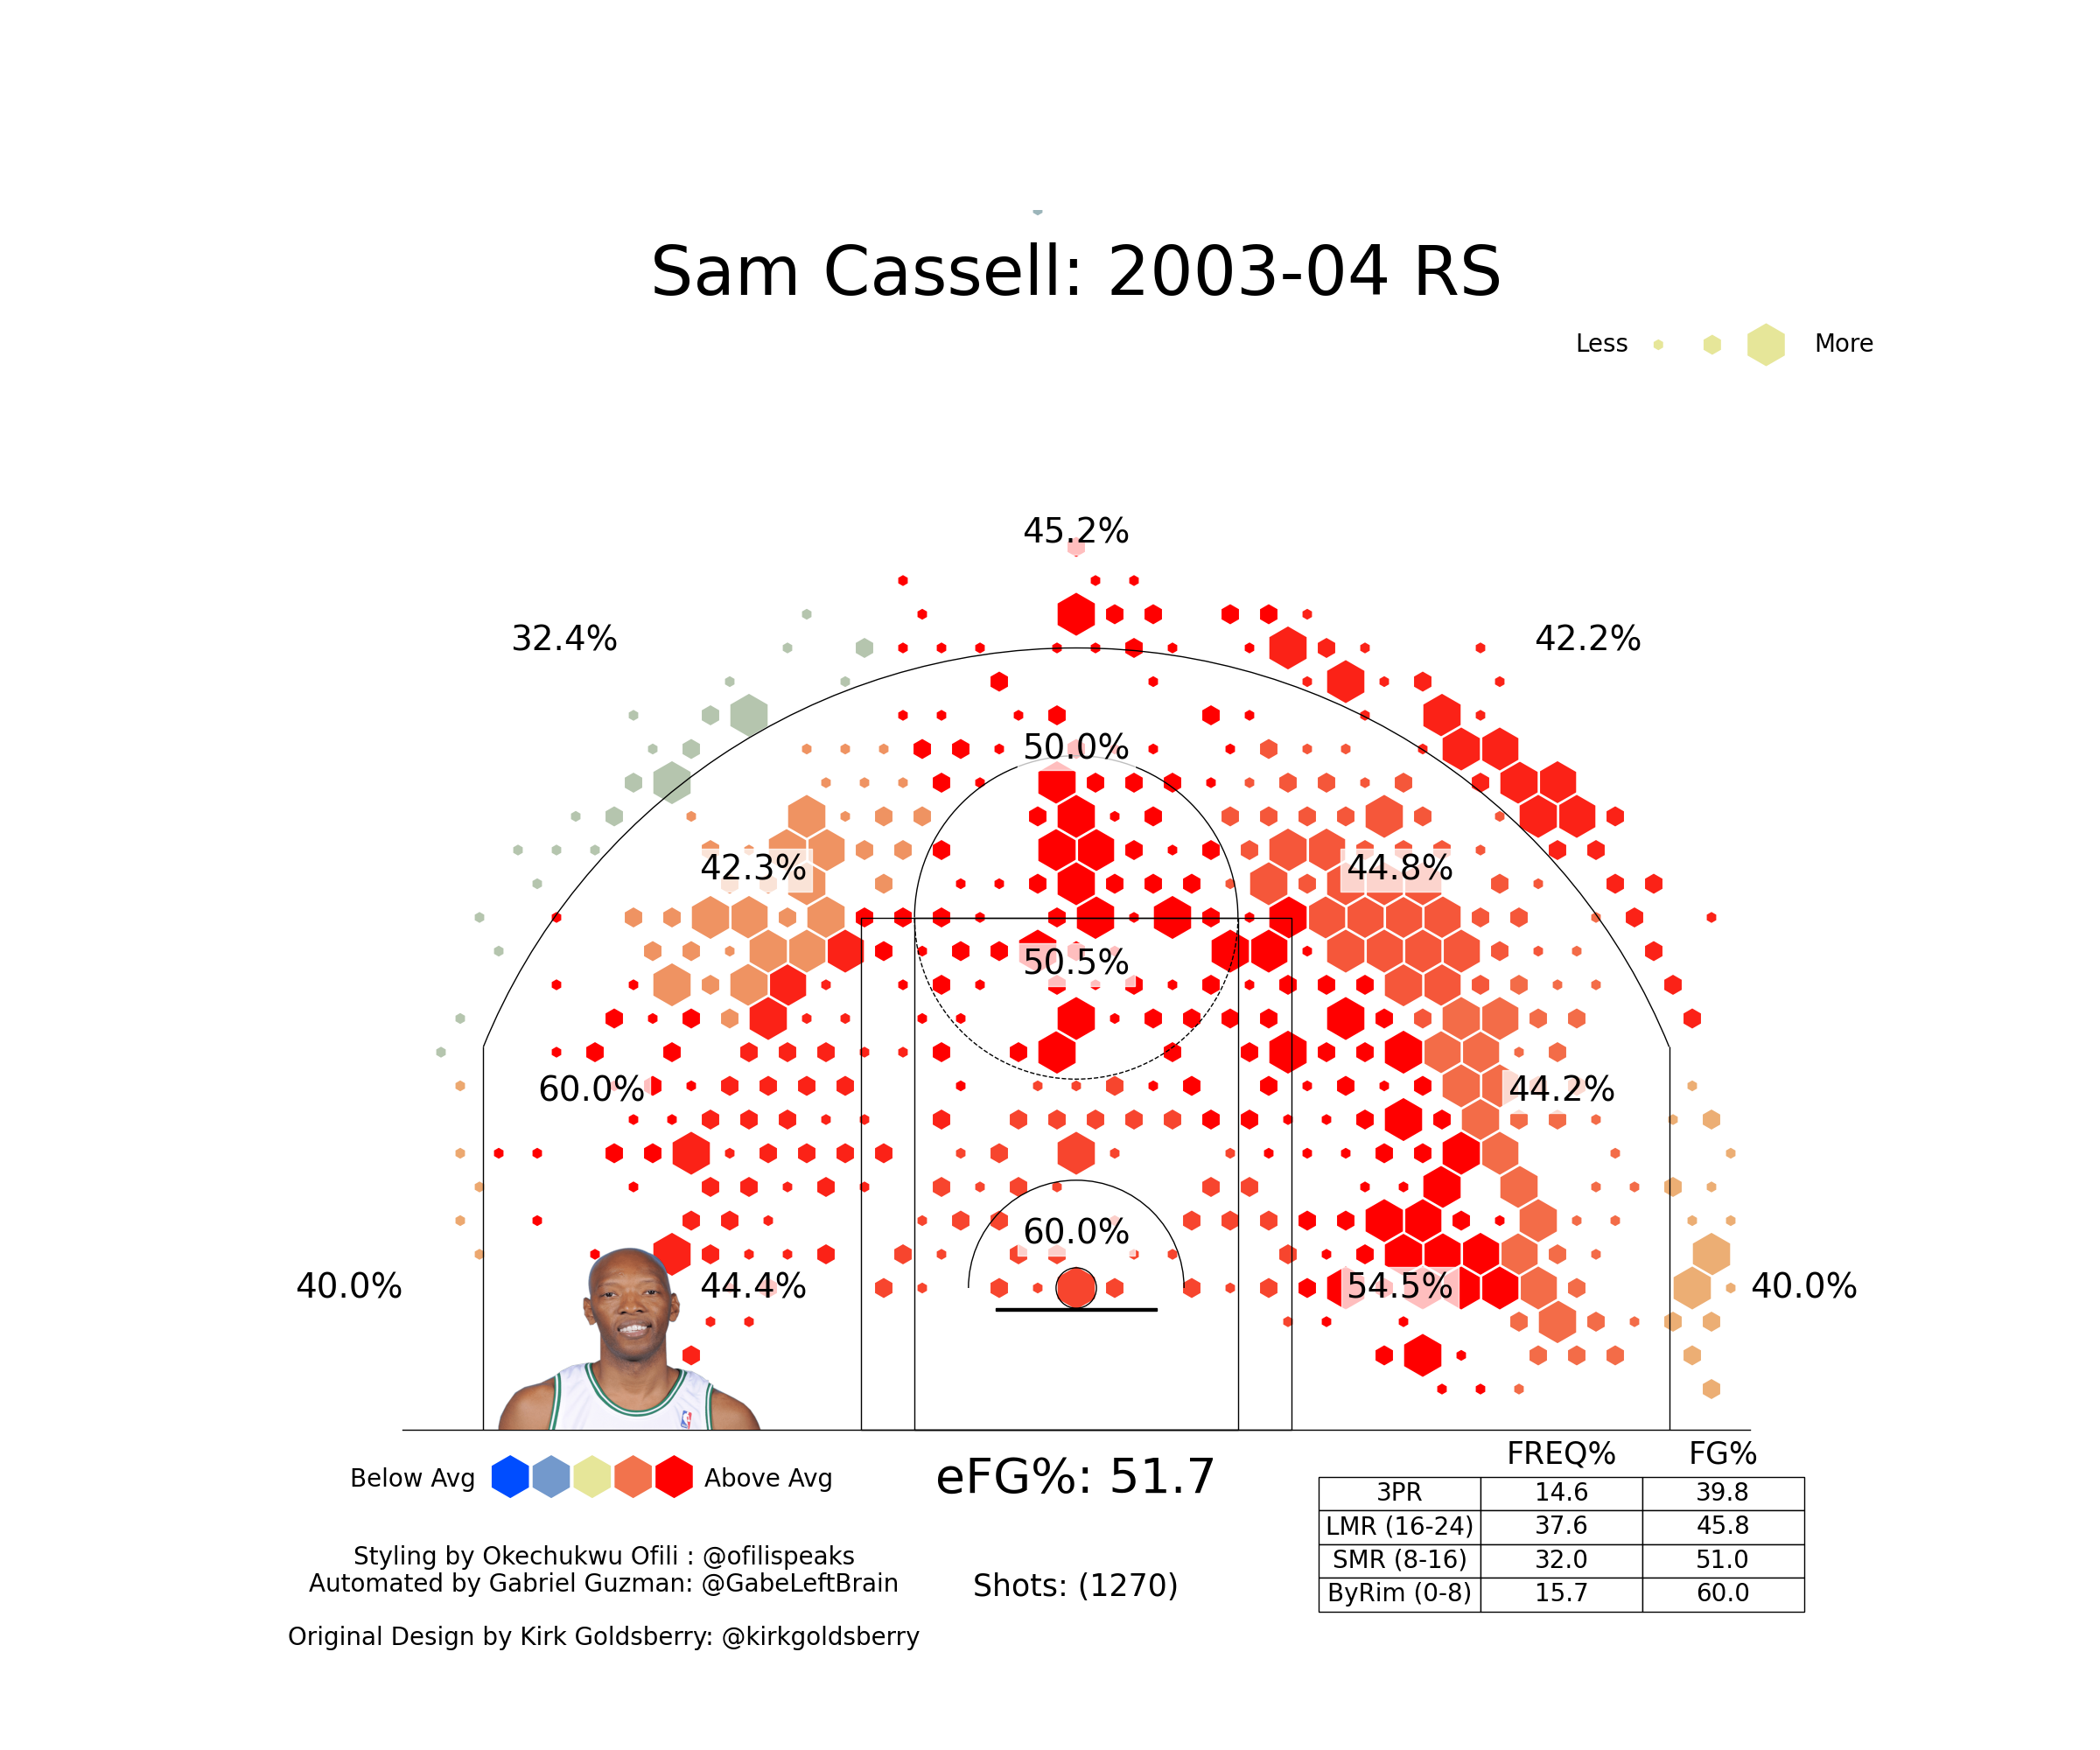
Unfortunately, he hurt his back late in the playoffs, and without him at full strength, the Wolves never stood a chance against the Lakers. It’s one of those “what if” seasons in NBA history, had Cassell stayed healthy, that Wolves team could have looked much more dangerous.
Two years later, Elton Brand’s 2006 campaign (+0.160 Shot_Making, +224 PA_envNorm) was equally eye-opening. Brand’s prime is often overlooked, but this was the year he dragged the Clippers to 47 wins and a second-round playoff run. He was virtually automatic from the short mid-range, hitting nearly 50% on a massive volume of those 8–16 footers, while also finishing strong at the rim. The result was one of the most efficient high-usage big man seasons of the era, right in the thick of the mid-2000s “dead-ball” environment where league pace and efficiency were at historic lows. His shot-making numbers underline just how rare it was for a power forward to be both a go-to volume scorer and this efficient at it.
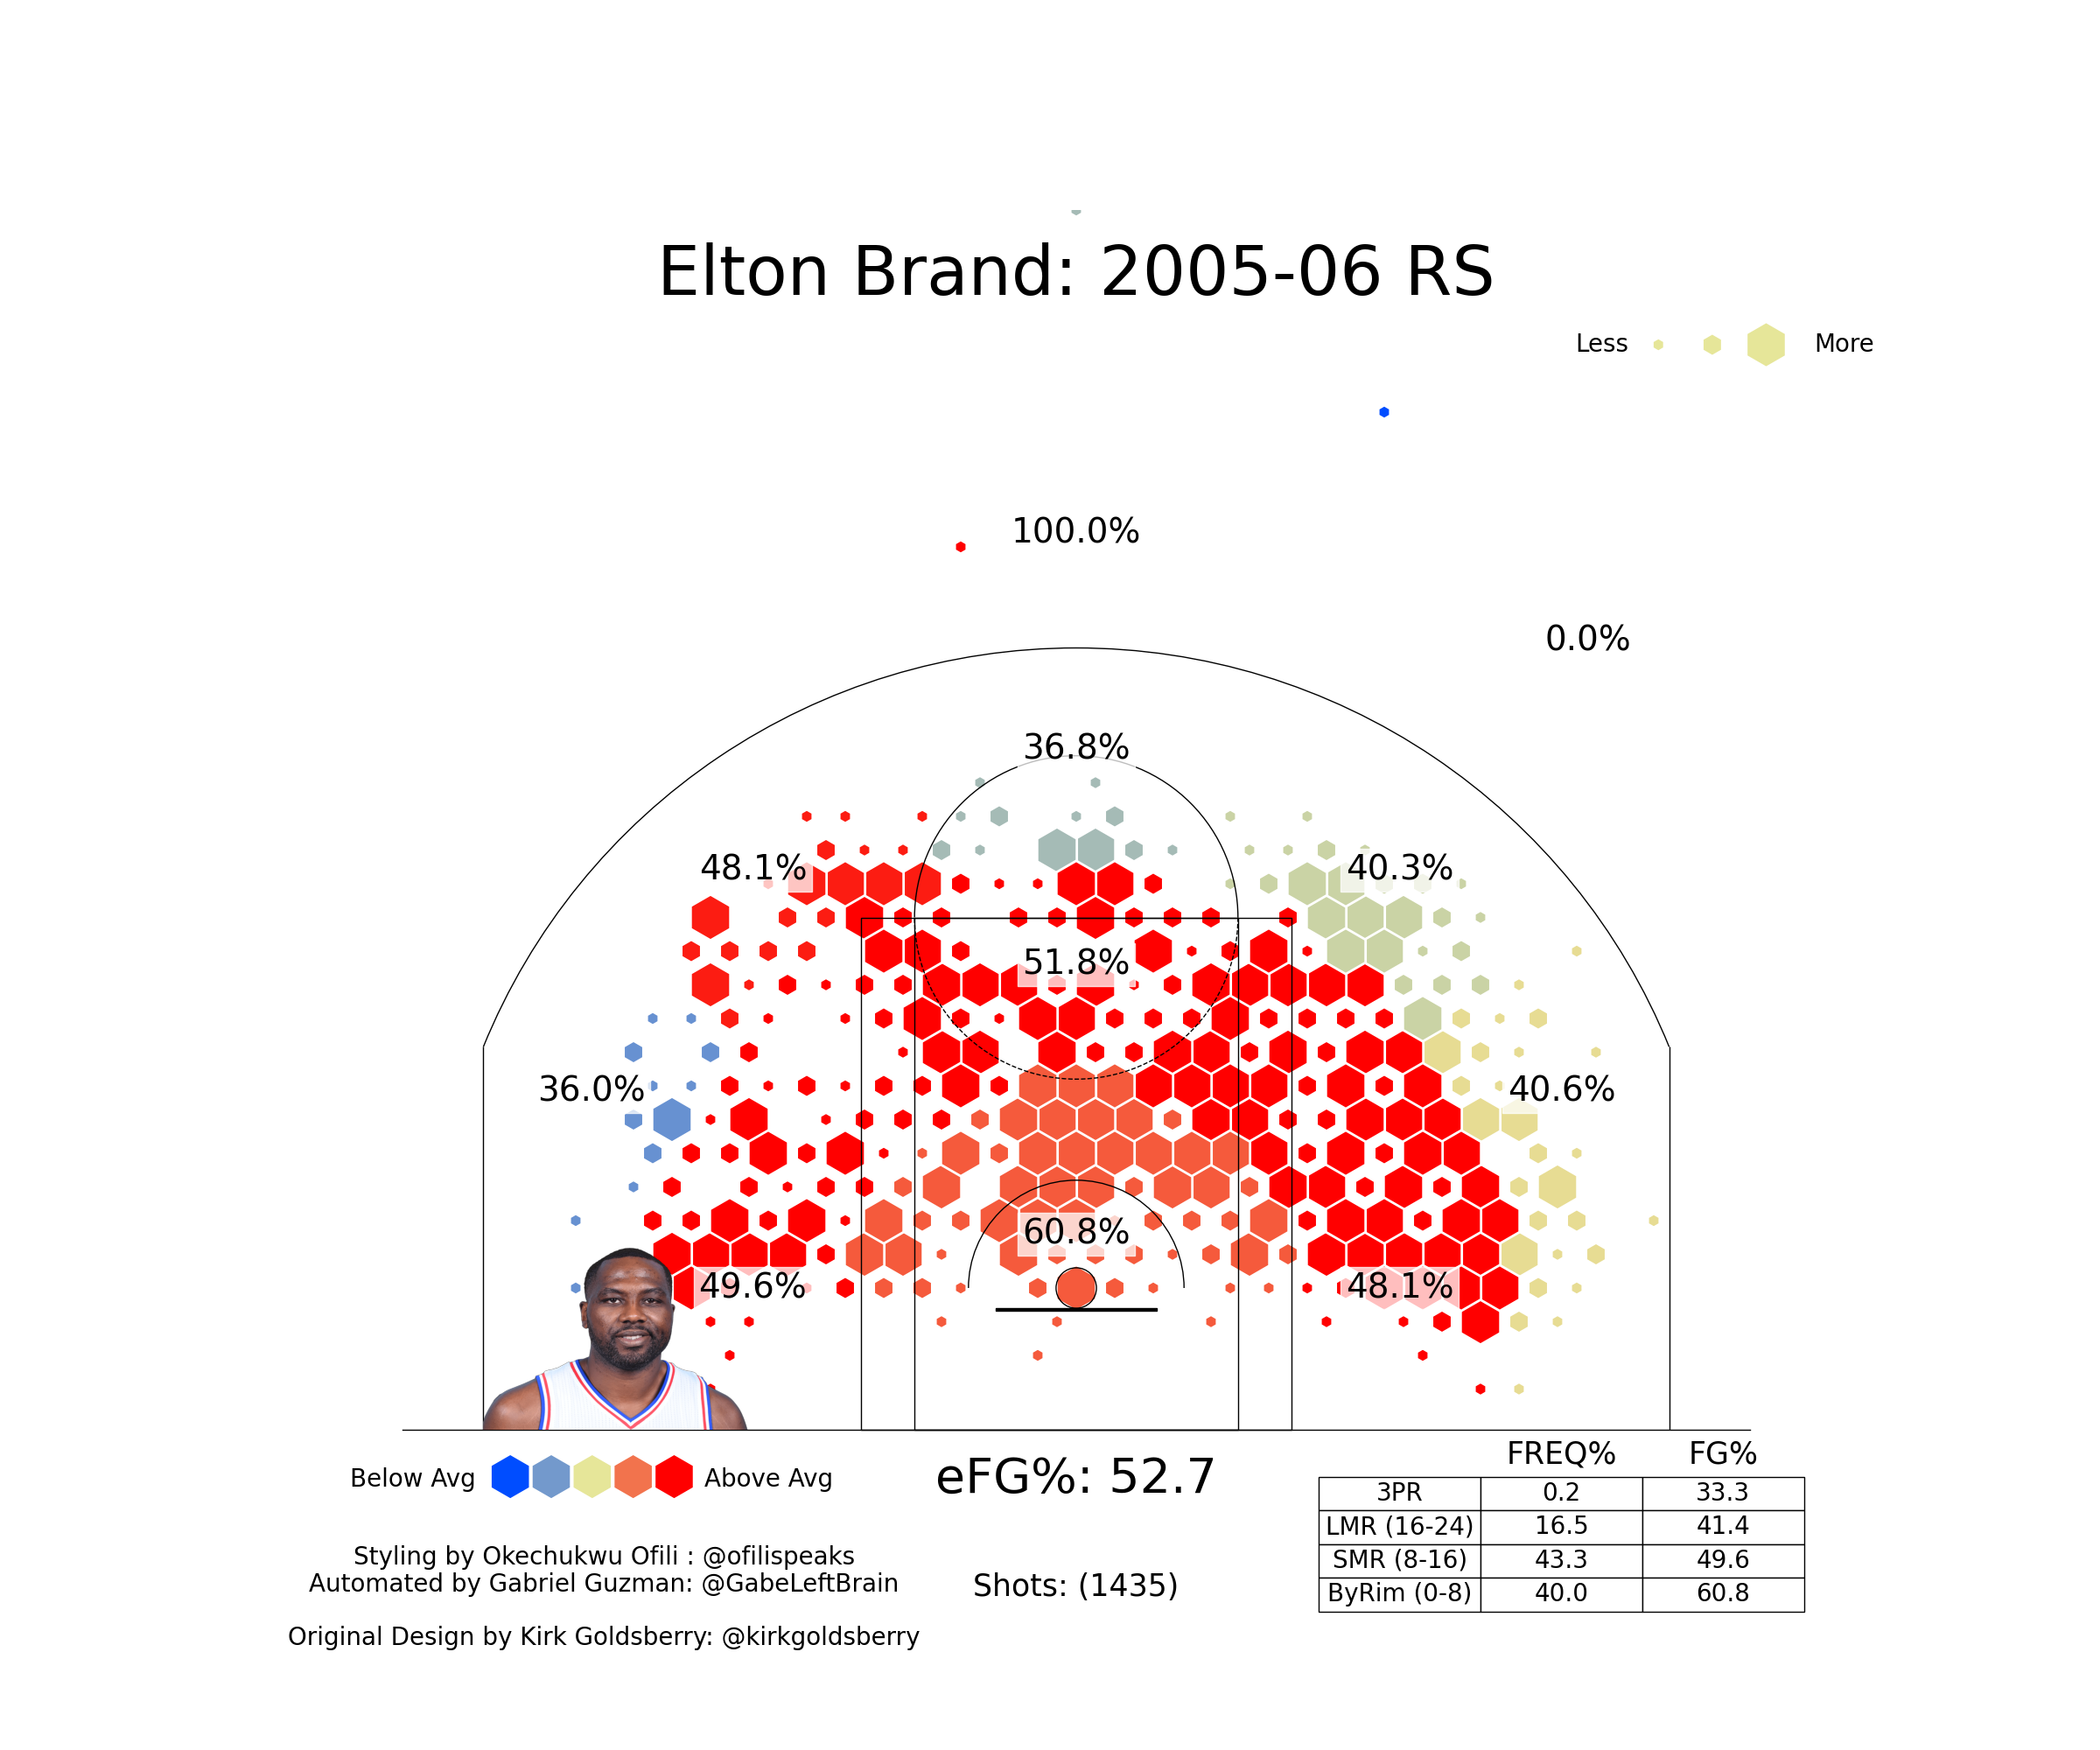
Cassell and Brand’s seasons serve as reminders that elite shot-making doesn’t just belong to the household names. Both were workmanlike stars who thrived in the mid-range-heavy basketball of their time, and both left behind individual years that stand up with some of the all-time greats in this metric.
Conclusion
This updated shot-making model sharpens our view of one of basketball’s hardest-to-define skills: turning difficult attempts into points. It measures the value of hitting shots that most players miss, and it does so with careful attention to context - accounting for clock, situation, and even era - so that comparisons across time actually hold weight.
The leaderboards highlight what we might already suspect: Steph Curry’s 2016 season remains in its own stratosphere, Kevin Durant’s efficiency has aged like fine wine, Dirk’s mid-range mastery shows up as historic, and Nikola Jokić bends the rules of shot difficulty with his touch around the basket. On the other side, they also reveal how much damage inefficient high-volume scoring can do. The model captures the double-edged nature of responsibility - a great shot-maker can swing games and seasons by adding hundreds of points above expectation, while a struggling one can cost their team just as much.
It’s also a reminder that this is one slice of the game, not the whole picture. Some of the names at the bottom of the shot-making charts were still offensive engines because of their gravity, passing, or ability to draw fouls. What this isolates is execution: how often did a player convert the shots they chose into more than what an average player would have produced? In that sense, it separates the art of selection from the craft of conversion.
Looking forward, this framework opens new doors. We can parse who the best mid-range artists were in a given season, who thrived on above-the-break threes, or who made a living off floaters. We can explore clutch-time shot-making, testing whether reputations like “Dame Time” or Kobe’s late-game heroics bear out in the data. And as seasons roll on, we’ll see which young players climb out of early inefficiency, which veterans sustain their touch, and whether anyone can ever touch Curry’s 2016 benchmark.
Shot-making will always live in the space between science and feel - a model can measure the probabilities, but the magic is in the players who consistently defy them. By putting numbers to those moments, we get a clearer appreciation of just how rare and valuable that skill really is.
As new seasons roll in, we’ll update these leaderboards and see if new trends emerge. The data will also be available at https://nbavisuals.com/shotmaking. Will anyone challenge Curry’s 2016 season as the peak? (It feels untouchable, but never say never in the NBA.) Can Kevin Durant keep defying Father Time and put up another +0.23 per-shot season at age 37? Which young players will climb out of the basement of shot-making as they develop – and which might unfortunately stay stuck there or even define a new low? With an ever-increasing emphasis on efficiency and shot analytics in the league, one would hope we’ll see fewer negatives and maybe even higher positives as players optimize their games.
This model doesn’t strip the magic away; it shows us just how extraordinary the game’s best shot-makers really are.